


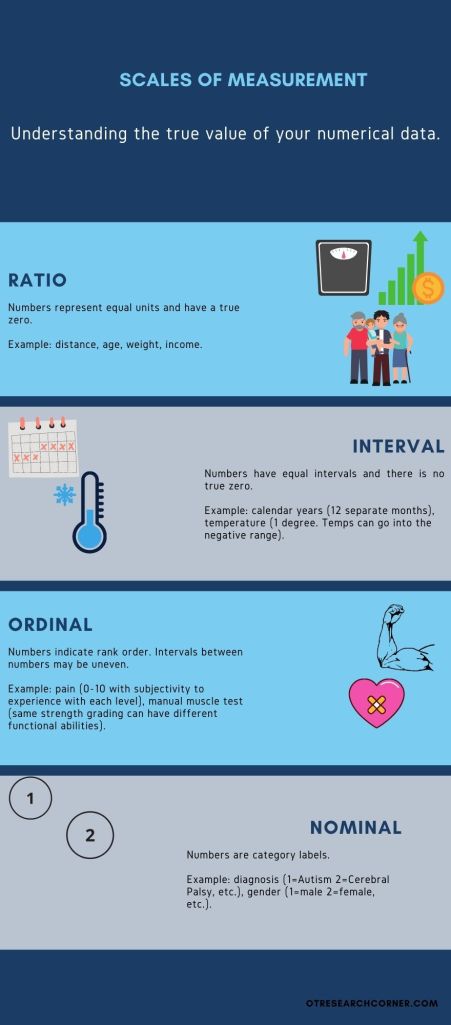
Scales of Measurement: Understanding the true value of your numerical data.
Classifying data into one of four scales of measurement is critical with data collection and statistical analysis.
When computing numerical data to determine statistical results, the first step with analysis is to determine the scale of your measurement.
In short, all numbers are not equal, and variation in the value of the numerical data affects what statistical analysis you can use and ultimately the meaning of your results.
Scales of measurement.
Ratio: Numbers represent equal units and have a true zero. Example: distance, age, weight, income.
Interval: Numbers have equal intervals and there is no true zero. Example: calendar years (12 separate months), temperature (1 degree. Temps can go into the negative range).
Ordinal: numbers indicate rank order. Intervals between numbers may be uneven. Example: pain (0-10 with subjectivity to experience with each level), manual muscle test (same strength grading can have different functional abilities).
Nominal: Numbers are category labels. Example: diagnosis (1=Autism 2=Cerebral Palsy, etc.), gender (1=male 2=female, etc.).
